For all first-time freshmen who graduated from a CSU in 2011, 2012 or 2013:
{{totalStudents}} students {{percentStudents}}% of total enrolled
{{inDescription}}
Graduated in {{outDescription}}
{{percentIn}}% of students with
{{inDescription}}
graduated in
{{outDescription}}
All {{gender}} students graduating from {{campusType}} campuses
{{yearsToGraduation}} {{whoText}}.
{{percentOfTotal}} of all freshman graduates (2011-2013)
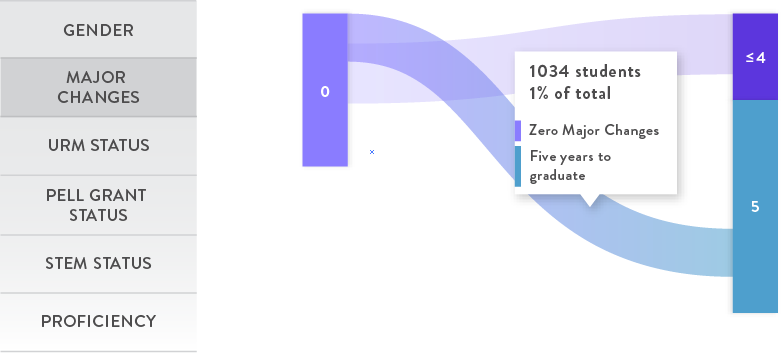
The Outcomes portion of this project allows you to explore student
characteristics and see how those characteristics affect the time it takes them to graduate.
Choose a characteristic to see how it translates to outcomes.
You can hover over bars on either side of the diagram or lines
connecting them. This will reveal statistics about the students within
those parameters.
Click some of the characteristics and explore for yourself.
Or move on to the Credit Accumulation view.
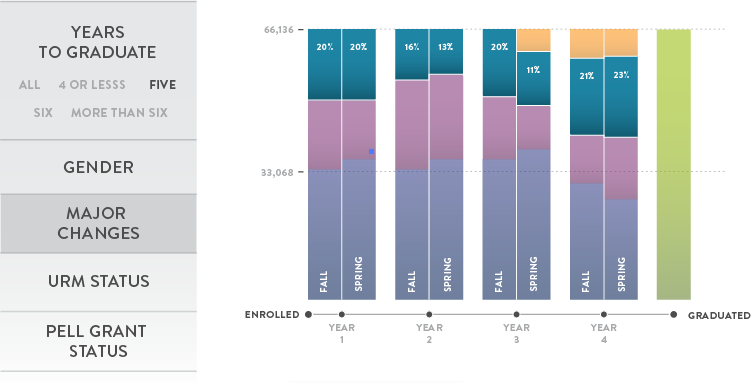
The credit accumulation portion of this project allows you to explore
student characteristics granularly and see patterns in students'
credit accumulation history.
Right now you're looking at all students from semester campuses that
took six or more years to graduate. Clickthe characteristics on the left to break down or changethe population.
Welcome to the CSU Graduation Report
California State University is the largest and most diverse
university system in the country.
Over 100,000 degress are awarded anually.
CSU graduates provide tremendous value, driving California's
economy in fields such as:
Life Sciences
Healthcare
Education
Business
Agriculture
Information Technology
Hospitality
Media & Entertainment
Public Administration
CSU students are largely reflective of California's diverse population.
More than half are students of color
One third are the first in their families to attend college
Three out of four work more than 20 hours per week
Half receive Pell grants for low-income status
Not surprisingly, CSU freshmen largely follow non-traditional paths
to earn their degree.
So what distinguishes CSU freshmen who graduate in four years
from those who take six or more years?
And is there anything we can learn from these differences?
This data visualization tool seeks to provide insight into these
important questions.